New York City Airbnb Open Data Analysis
Contents
New York City Airbnb Open Data Analysis
以下流程参考自 https://www.kaggle.com/code/chirag9073/airbnb-analysis-visualization-and-prediction
导入库
using MLJFlux, Flux, MLJ, DataFrames, CSV, StatsBase
using WordCloud
加载数据
origindata = CSV.read("data/newyork-city-airbnb-open-data/AB_NYC_2019.csv", DataFrame)
观察数据
你可以像教程那样


也可以,像我一样,用 excel 打开 csv 文件
 我写了一个表格,记录我观察到的结果
| column | missing count | type | type coerce | fill/drop |
|---|---|---|---|---|
| id | 0 | Int | Count => Continuous | None |
| name | 16 | String? | Multiclass | Drop |
| host_id | 0 | Int | Count => Continuous | None |
| host_name | 21 | String? | Multiclass | Drop |
| neighbourhood_group | 0 | String15 | Multiclass => Count => Continuous | None |
| neighbourhood | 0 | String31 | Multiclass => Count => Continuous | None |
| latitude | 0 | Float64 | Continuous | None |
| longitude | 0 | Float64 | Continuous => Multiclass => Continuous | None |
| room_type | 0 | String15 | Multiclass => Count => Continuous | None |
| price | 0 | Int | Count => Continuous | None |
| minimum_nights | 0 | Int | Count => Continuous | None |
| number_of_reviews | 0 | Int | Count => Continuous | None |
| last_review | 10052 | Date? | Date => Count => Continuous ? | Drop |
| reviews_per_month | 10052 | Float64? | Continuous | Drop |
| calculated_host_listings_count | 0 | Int | Count => Continuous | None |
| availability_365 | 0 | Int | Count => Continuous | None |
你可以用这段代码来观察 missing 的数据量
for column in names(origindata)
  _count = count(ismissing, origindata[!, column])
  println("$column: missing $_count data")
end
数据清洗
基于上述数据观察,我们这样确定清洗流程, 首先我们选择抛弃的特征
featureSelector = FeatureSelector(
  features = [:id, :name, :host_name, :last_review],
  ignore = true
)
:last_review 字段已被抛弃,有相似的字段 :reviews_per_month 存在过多缺失值,这里决定丢弃缺失的行
dropMissing(dataframe::DataFrame) = begin
  dropmissing(dataframe, :reviews_per_month)
end
:longitude 字段我们发现,他的数值在 -74, -75 上下,我们把他记为 1 和 2
processLongitude(dataframe::DataFrame) = begin
  dataframe[!, :longitude] = map(floor, dataframe[!, :longitude])
  array = unique(dataframe[!, :longitude])
  dict = Dict{Float64, Float64}()
  for (index, value) in Iterators.enumerate(array)
    dict[value] = index
  end

  dataframe[!, :longitude] = map(x -> dict[x], dataframe[!, :longitude])
  return dataframe
end
:neighbourhood_group 字段有多个重复的值,我们将其进行编码
processNeighbourhoodGroup(dataframe::DataFrame) = begin
  array = unique(dataframe[!, :neighbourhood_group])
  dict = Dict{String, Int}()
  for (index, value) in Iterators.enumerate(array)
    dict[value] = index
  end

  dataframe[!, :neighbourhood_group] = map(x -> dict[x], dataframe[!, :neighbourhood_group])

  return dataframe
end
:neighbourhood 和 :room_type 也是类似的
processNeighbourhood(dataframe::DataFrame) = begin
  array = unique(dataframe[!, :neighbourhood])

  dict = Dict{String, Int}()
  for (index, value) in Iterators.enumerate(array)
    dict[value] = index
  end

  dataframe[!, :neighbourhood] = map(x -> dict[x], dataframe[!, :neighbourhood])

  return dataframe
end

processRoomType(dataframe::DataFrame) = begin
  array = unique(dataframe[!, :room_type])
  dict = Dict{String, Int}()
  for (index, value) in Iterators.enumerate(array)
    dict[value] = index
  end

  dataframe[!, :room_type] = map(x -> dict[x], dataframe[!, :room_type])

  return dataframe
end
别忘了将科学类型 Count 改为 科学类型 Continuous
coerceCount(dataframe::DataFrame) = begin
  coerce(dataframe, Count => Continuous)
end
最后转换数据
transformModel = Pipeline(
  featureSelector,
  dropMissing,
  processLongitude,
  processNeighbourhoodGroup,
  processNeighbourhood,
  processRoomType,
  coerceCount
)

transformMachine = machine(transformModel, origindata)
fit!(transformMachine)
transformedData = MLJ.transform(transformMachine, origindata)
数据可视化
别忘了导入库和设置 plot 后端
using Plots, StatsPlots
plotly()
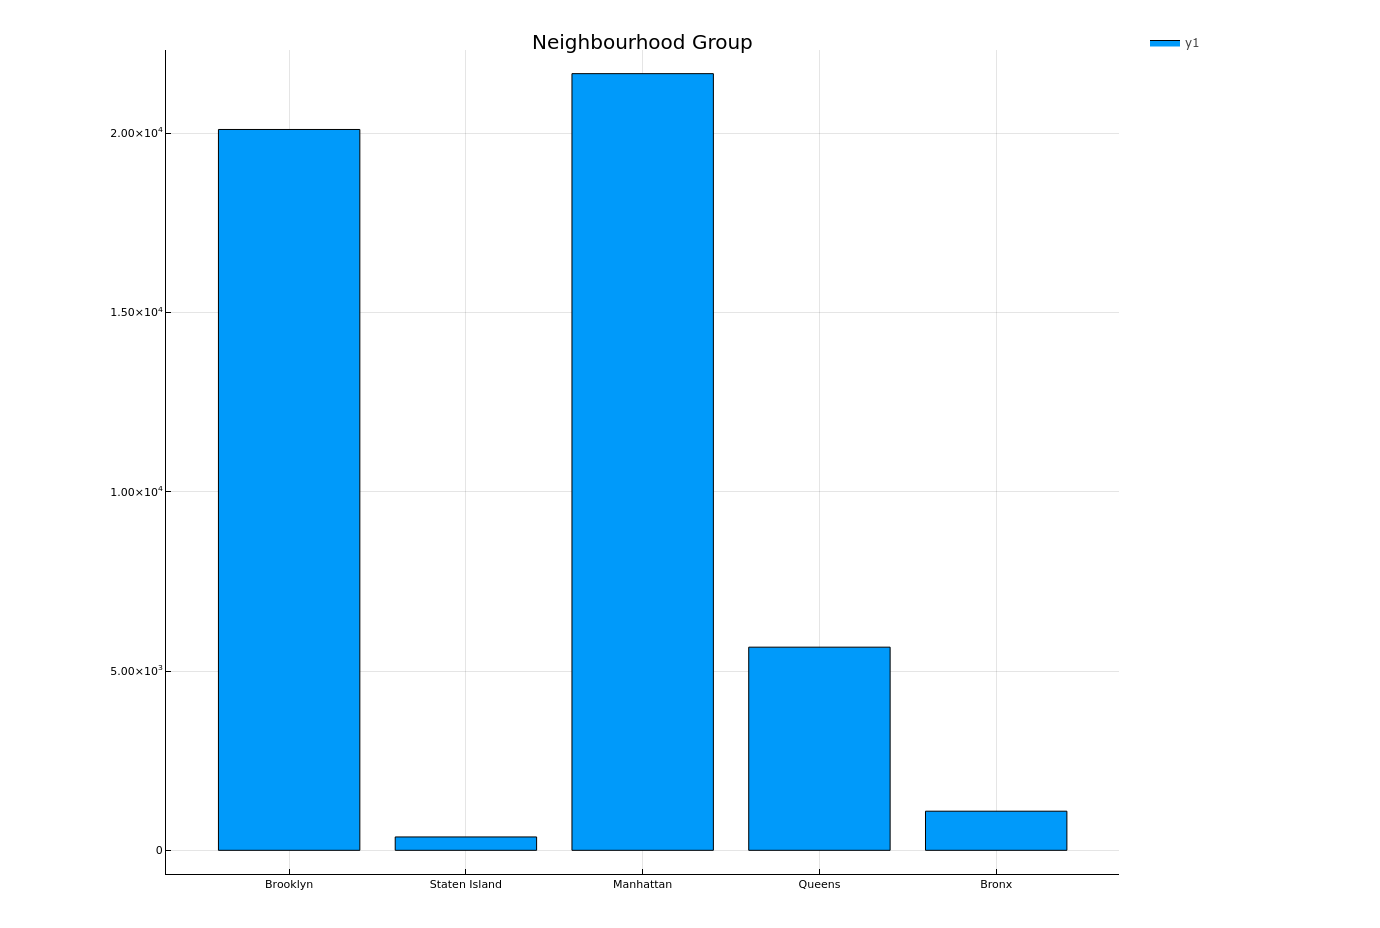
Plotting all neighbourhood group
let
  counts = countmap(origindata[!, :neighbourhood_group])
  bar(collect(keys(counts)), collect(values(counts)),
      title = "Neighbourhood Group") |> display
end
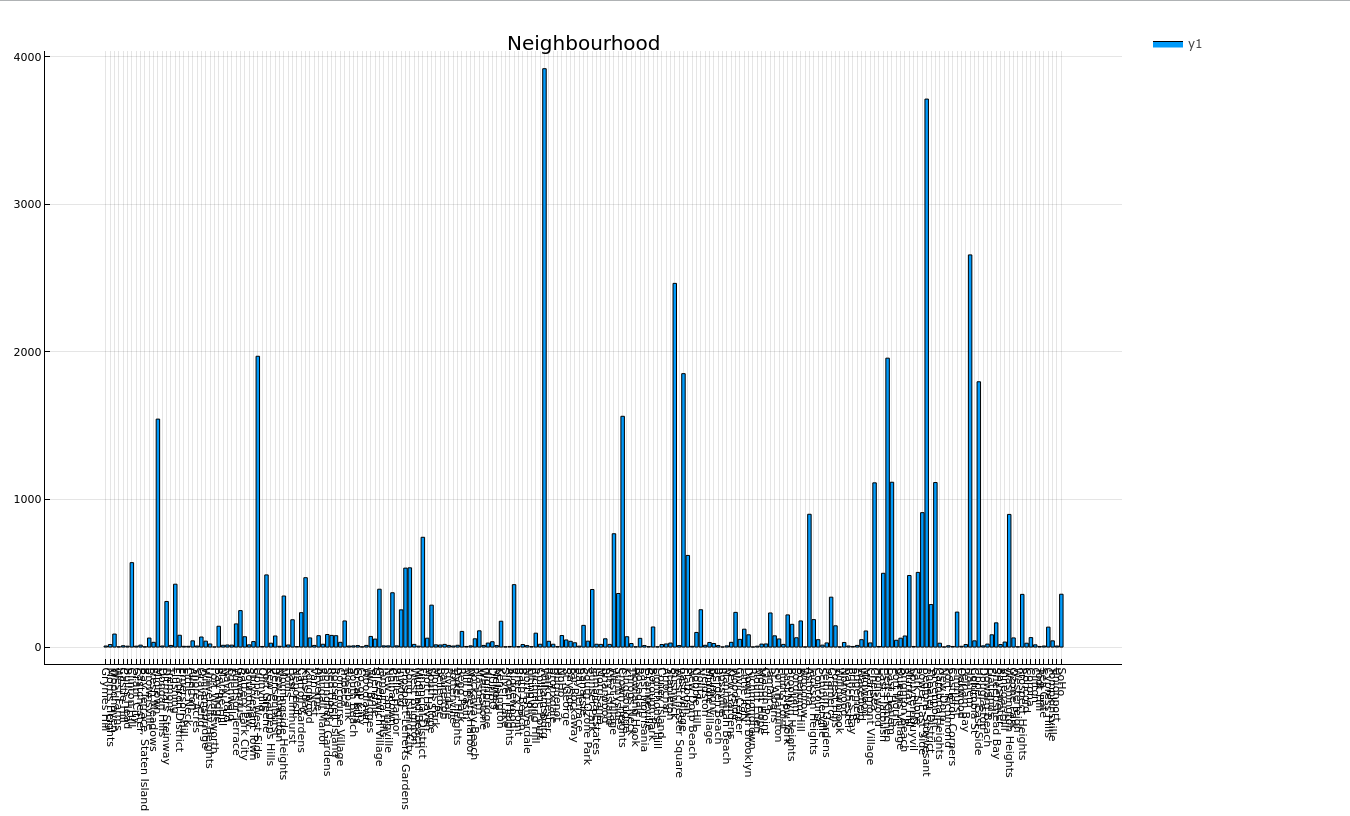
Plotting neighbourhood
let
  counts = countmap(origindata[!, :neighbourhood])
  bar(collect(keys(counts)), collect(values(counts)),
      xrotation = -90,
      xticks = :all,
      size = (1920, 1680),
      title = "Neighbourhood") |> display
end
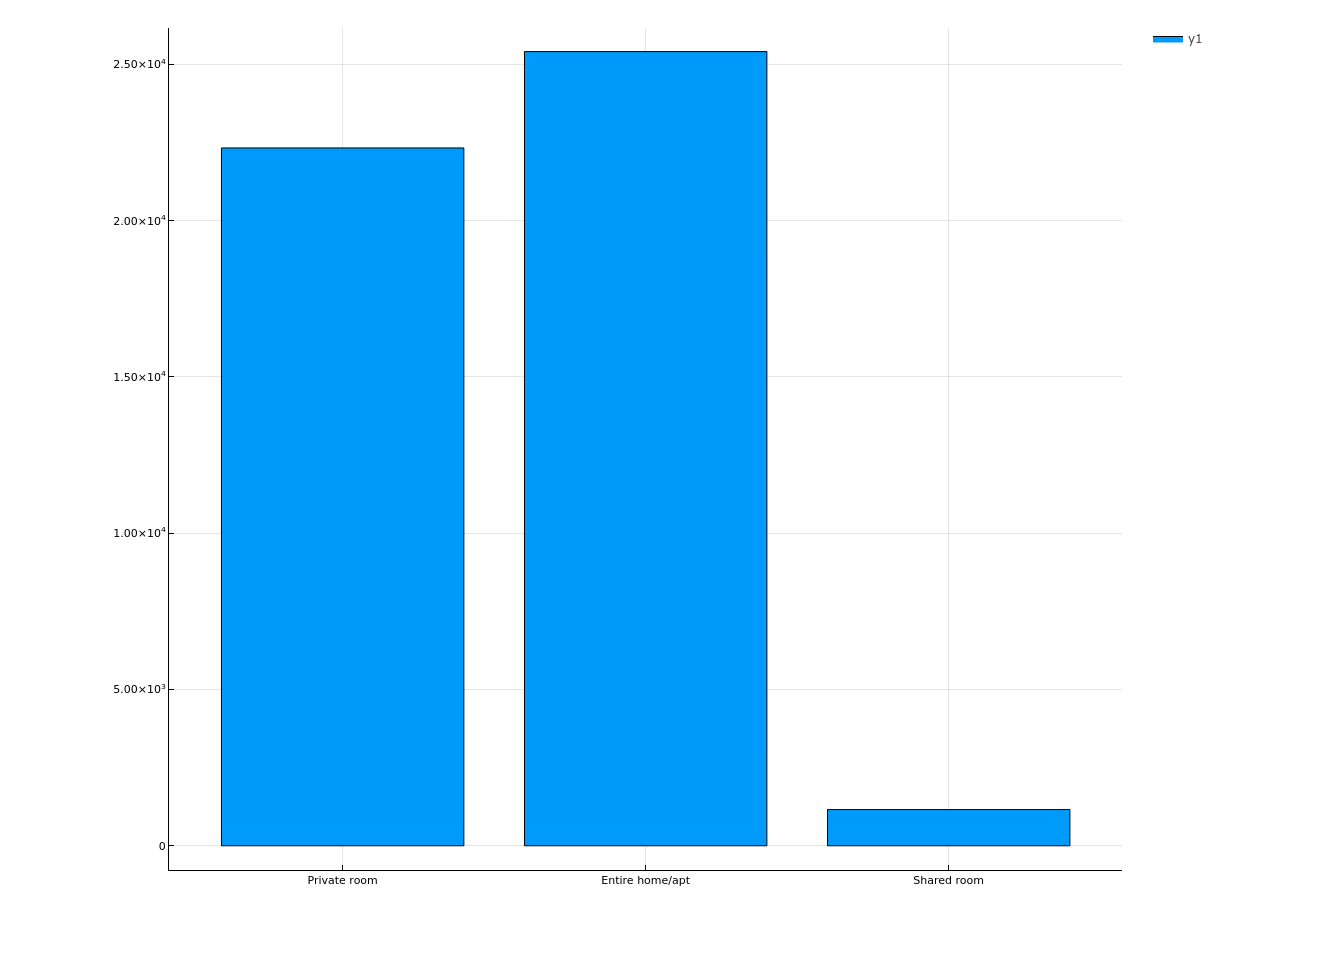
Plotting room type
let
  counts = countmap(origindata[!, :room_type])
  bar(collect(keys(counts)), collect(values(counts))) |> display
end
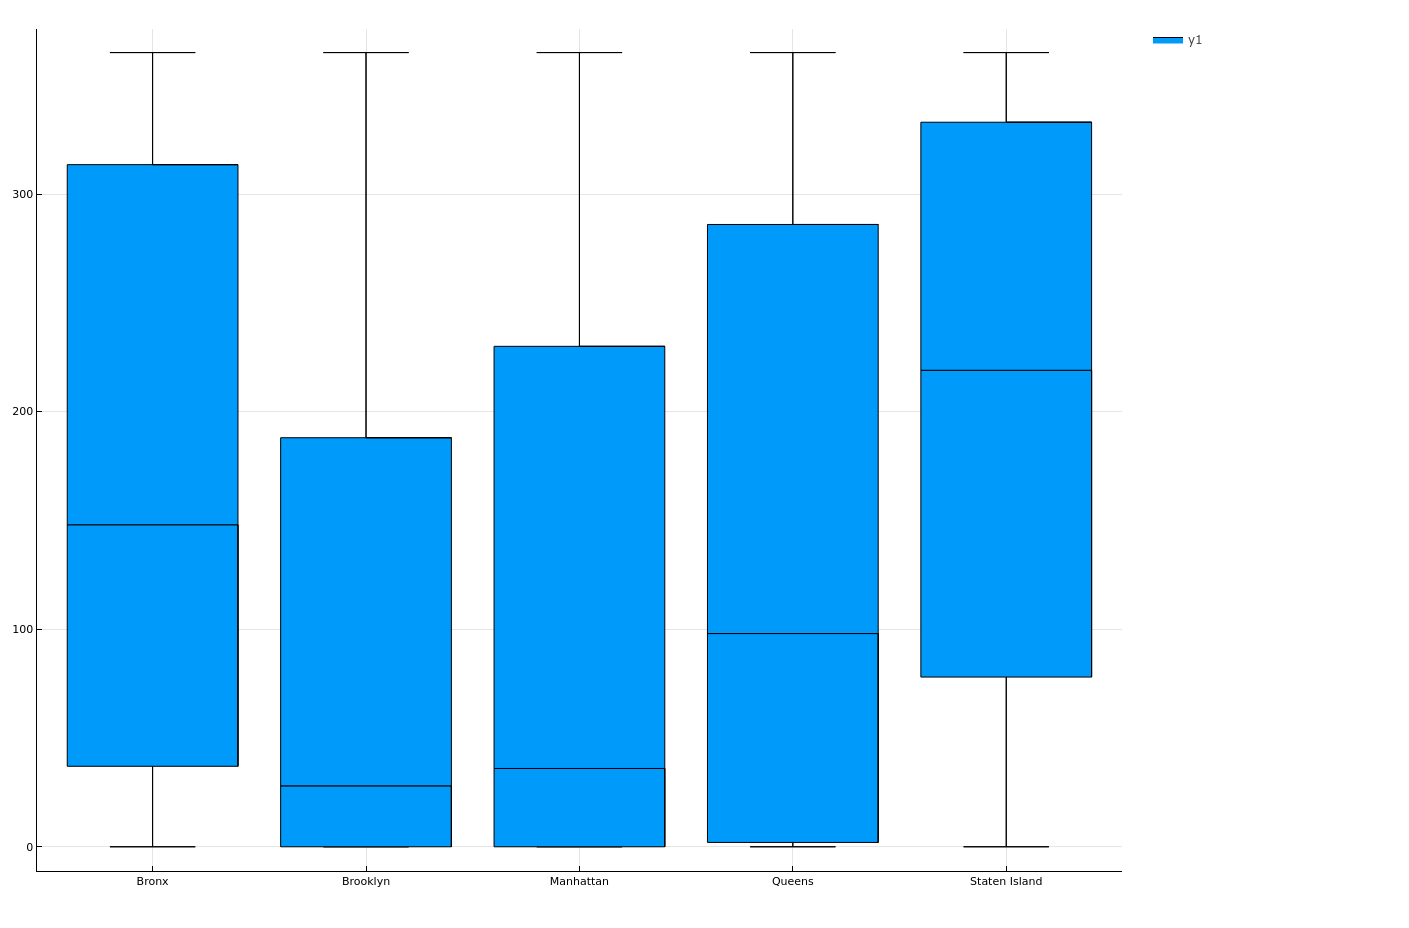
Plotting relation between neighbourhood_group and availability_365 of room
let
  x = origindata[!, :neighbourhood_group]
  y = origindata[!, :availability_365]
  boxplot(x, y) |> display
end
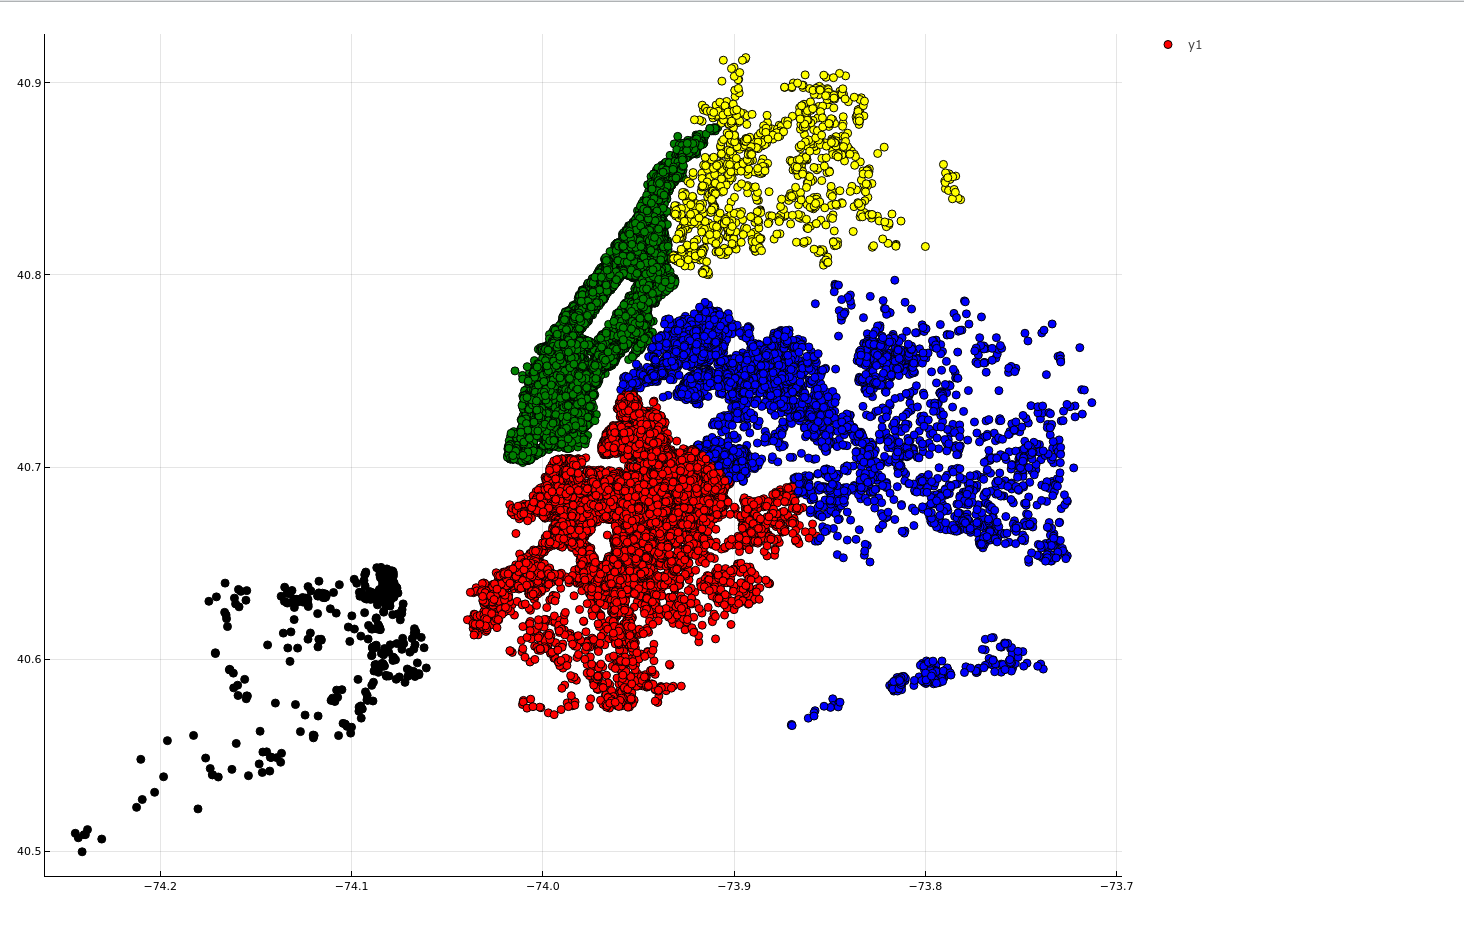
Plotting map of neighbourhood_group
let
  array = unique(origindata[!, :neighbourhood_group])
  colors = [:red, :green, :blue, :black, :yellow]
  dict = Dict{String, Symbol}()

  for (index, value) in Iterators.enumerate(array)
    dict[value] = colors[index]
  end

  markercolors = map(x -> dict[x], origindata[!, :neighbourhood_group])
  scatter(origindata[!, :longitude], origindata[!, :latitude],
	  markercolor = markercolors,
	  size = figuresize) |> display
end
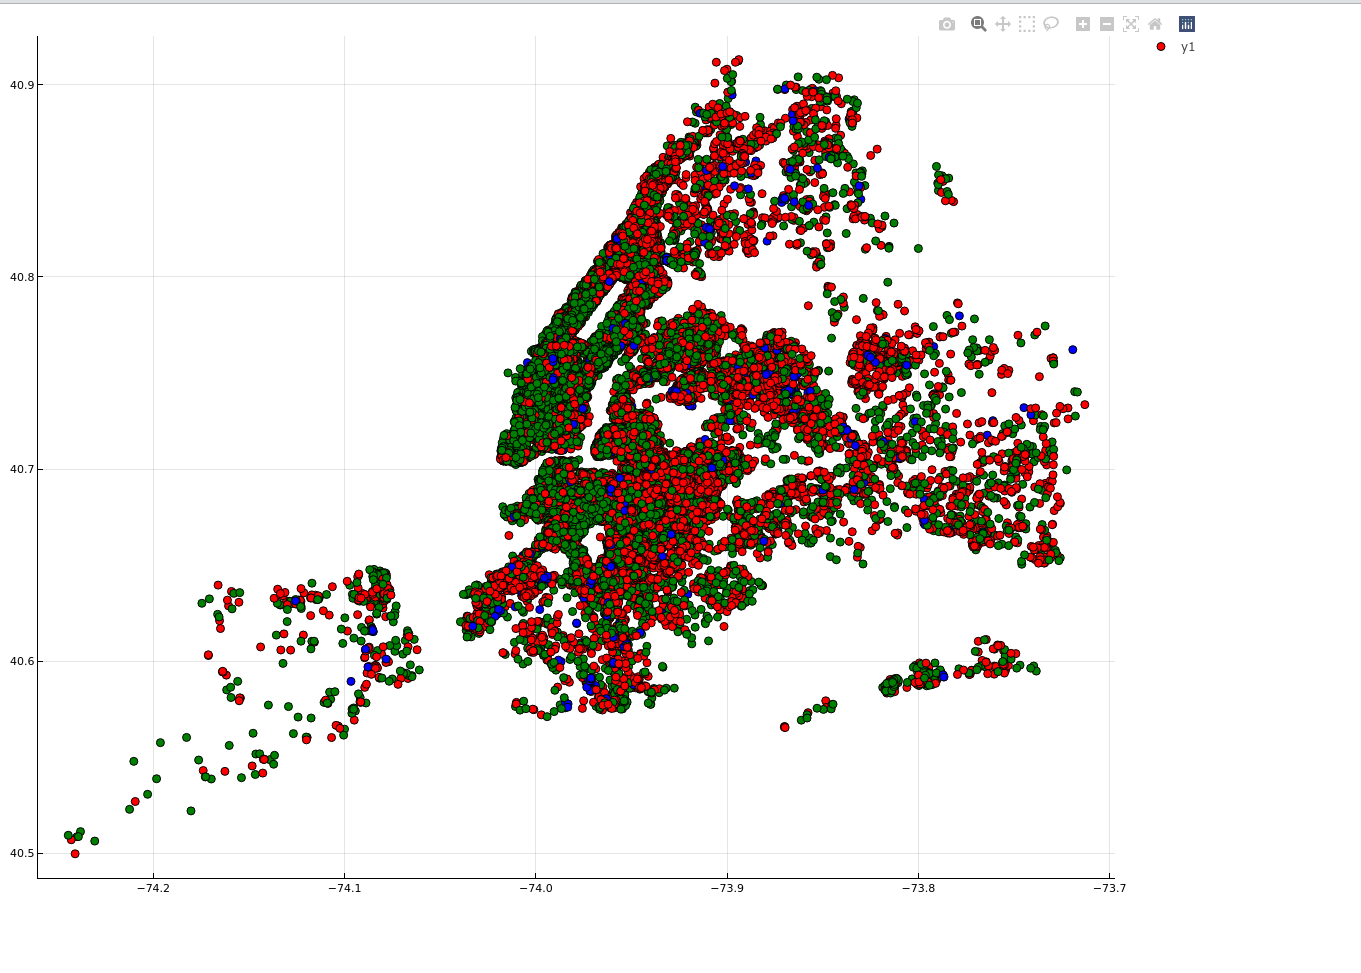
Plotting map of neighbourhood
let
  array = unique(origindata[!, :room_type])
  colors = [:red, :green, :blue]
  dict = Dict{String, Symbol}()
  for (index, value) in Iterators.enumerate(array)
    dict[value] = colors[index]
  end

  markercolors = map(x -> dict[x], origindata[!, :room_type])
  scatter(origindata[!, :longitude], origindata[!, :latitude],
	  markercolor = markercolors,
	  size = (1980, 1600)) |> display
end
Plotting availability of room
let
  mapcolor(number::Number) = begin
    if number >= 0 && number < 150
      return :red
    elseif number >= 150 && number < 300
      return :green
    elseif number >= 300 && number < 450
      return :blue
    else
      return :black
    end
  end

  markercolors = map(mapcolor, origindata[!, :availability_365])
  scatter(origindata[!, :longitude], origindata[!, :latitude],
	  markercolor = markercolors,
	  size = figuresize |> display
end

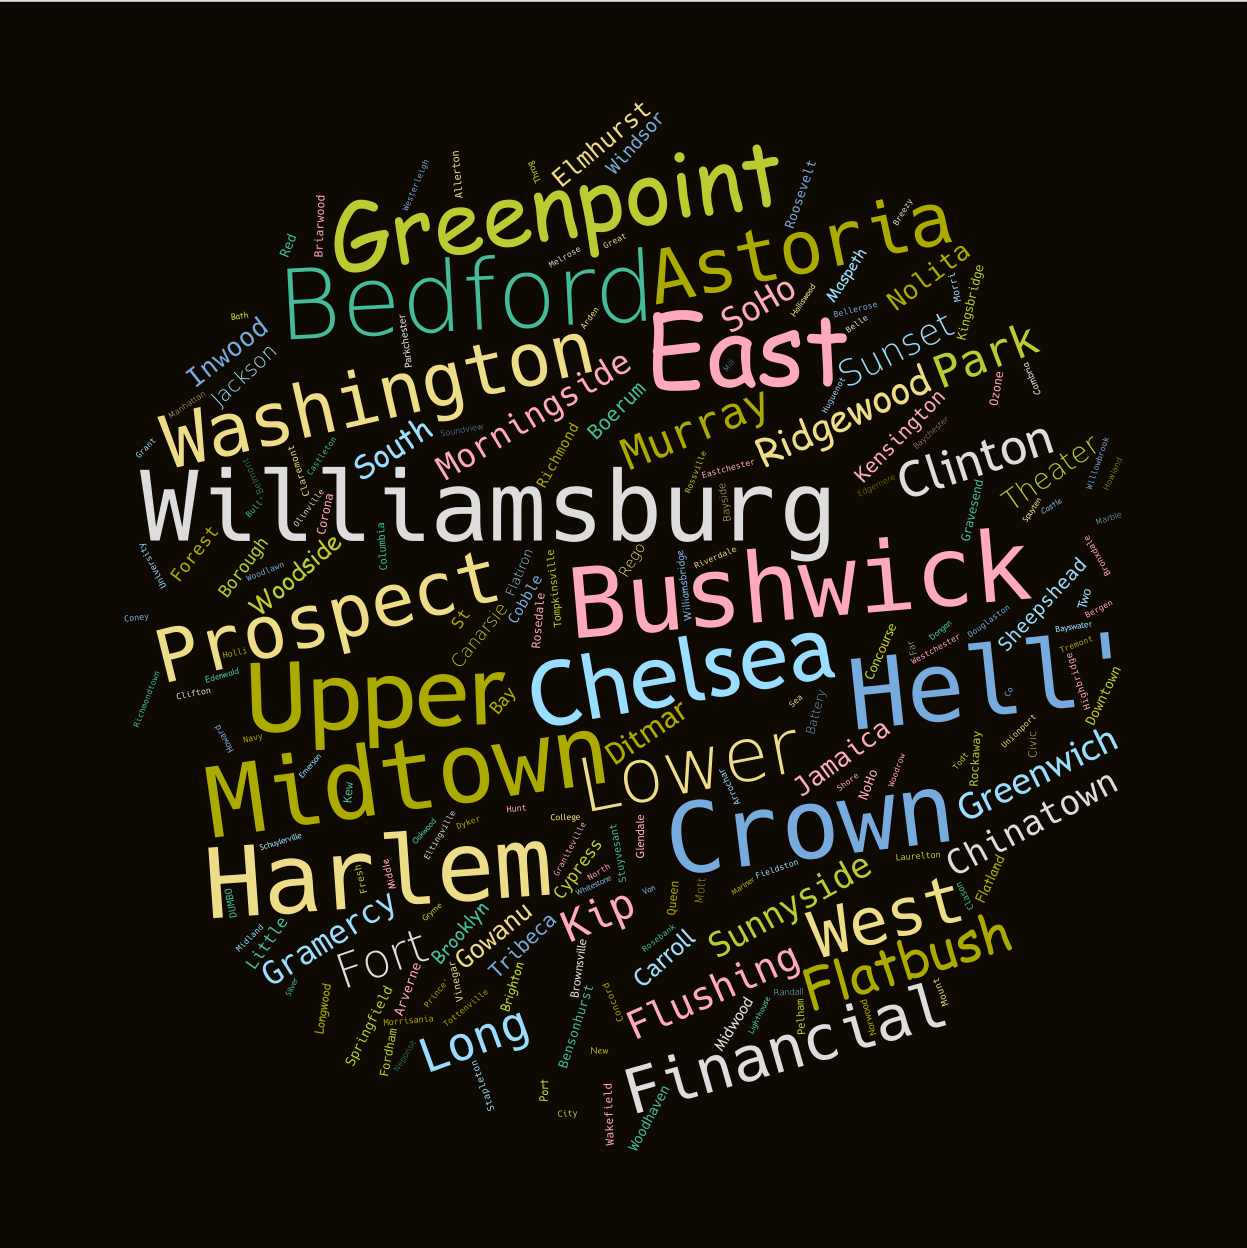
Word Cloud
using WordCloud
wc = wordcloud(origindata[!, :neighbourhood]) |> generate!
paint(wc, "/home/steiner/Downloads/neighbourhood.png")
